Web Applications
A grocery price history built from my own receipts
Built by Sheena Marie Tolentino
I photograph every grocery receipt and this turns them into a per-item price history, which has changed what I buy and where.
Builder email verified
Verification
- Type
- Personal
- Category
- Web Applications
- Published
- Jul 26, 2026
- Updated
- Jul 26, 2026
About this project
- What I built & why
In 2023 I had the very ordinary experience of being sure that things cost more than they used to and having no evidence, only a feeling and a smaller amount of money at the end of the month. I already had a folder of receipt photos because I photograph them out of habit. So I spent a few weekends turning that folder into data, mostly to answer one question: is the thing I think has doubled actually the thing that has doubled? It turned out not to be. The expensive change was in items I had never thought about, which is exactly the kind of thing you cannot see without a record.
- The problem
It is for me and for my partner, who now asks it things. It reads receipt photos, extracts the line items and prices, normalises the shop's abbreviations into names I chose, and stores a price per item per shop per date. Then it answers questions: what has this item cost over two years, which shop is cheaper for the things we actually buy rather than in general, and what is driving the difference between a heavy month and a light one. It does not budget and it does not categorise spending — there are plenty of tools for that and none of them know what a kilo of rice cost in March.
- What I owned
All of it. The extraction is the part that took real work: receipt photos taken one-handed in a car park are badly lit and skewed, so there is a preprocessing step that deskews and thresholds before any text extraction happens, and even then the output needs cleaning. The normalisation is a mapping table I maintain by hand — shops abbreviate wildly and inconsistently, and I decided early that a hand-maintained mapping with a review queue for unknown codes was more honest than a clever matcher that would be quietly wrong. The querying and charting are the easy tenth of the project.
- Technical & product decisions
I chose a review queue over automatic matching for anything the extractor was not confident about, which means about one receipt in six needs thirty seconds of my attention. That is the decision that makes the data trustworthy enough to act on, and I have never regretted it, although I did resent it for the first two months. I also decided to store the raw extracted text alongside the parsed line items, so that when I improve the parser I can re-run it over the whole history rather than only over new receipts — I have done that three times and each time it corrected records going back years.
- Hardest challenge
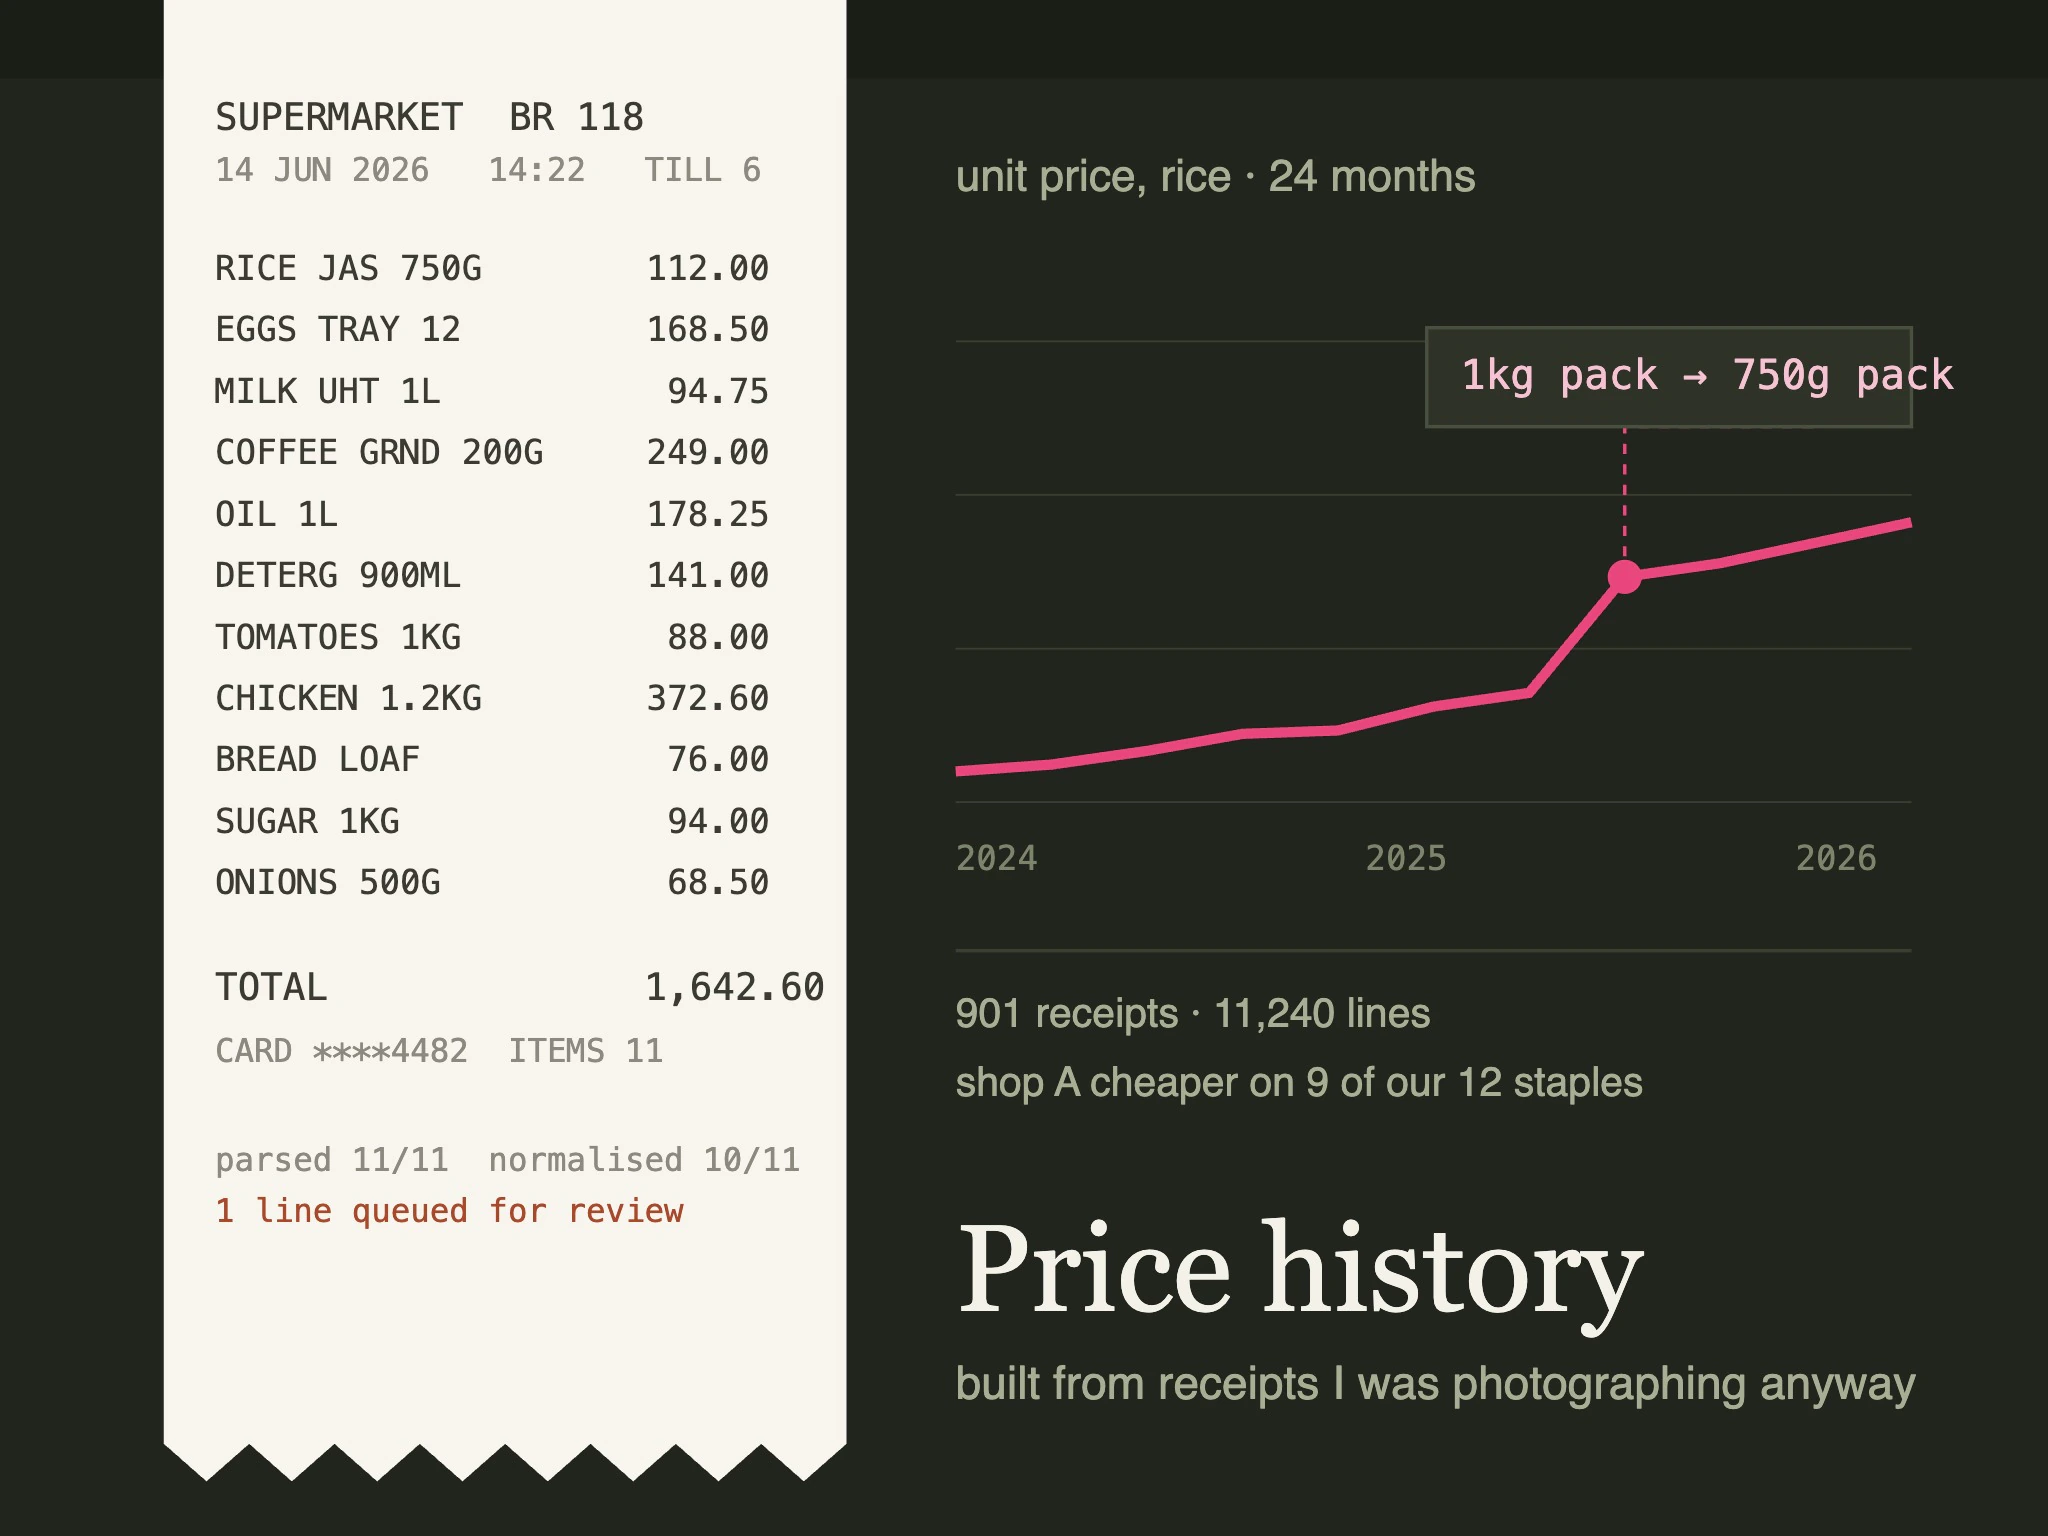
The hard problem was that the same product is not the same string. A shop renames items, changes pack sizes, and reuses codes; a price that appears to have jumped forty per cent is usually a pack going from one kilo to seven hundred and fifty grams. Until I modelled unit price and pack size separately from the line item, the whole dataset told a confident and wrong story. Fixing that meant going back through about eight hundred receipts to attach sizes, some of which I had to infer, and I marked those as inferred so I would not later believe them.
- Result & impact
Two years of receipts, roughly nine hundred of them, around eleven thousand line items. We changed where we buy about a dozen staples and the measured difference is a bit over two thousand pesos a month, which is not life-changing and is a real number I can point at. The unexpected outcome was noticing pack sizes shrinking, which I would not have believed without the data and now cannot stop seeing. My partner uses the shop comparison before a big trip and ignores everything else in it.
- Who else worked on it
My partner does the normalisation review more often than I do now, and has better judgement about when two entries are the same product.