Web Applications
A water-change log for two aquariums
Built by Ronnel Ilagan
A small page that records water tests and changes for the two tanks in our living room, and tells me when I am about to lose a fish.
Builder email verified
Verification
- Type
- Personal
- Category
- Web Applications
- Published
- Jul 26, 2026
- Updated
- Jul 26, 2026
About this project
- What I built & why
I keep two freshwater tanks, one of which has been running for six years and one that I set up during a bad month in 2023. Keeping fish alive is mostly about noticing a trend early — a nitrate creeping up over three weeks means something changed, and you cannot see three weeks in your head. I had been writing test results on a piece of paper taped inside the cabinet, which works until the paper gets wet. So I built the smallest possible thing that takes a test result and plots it, and then over a year it grew a reminder and a note field. It is genuinely useful and completely trivial.
- The problem
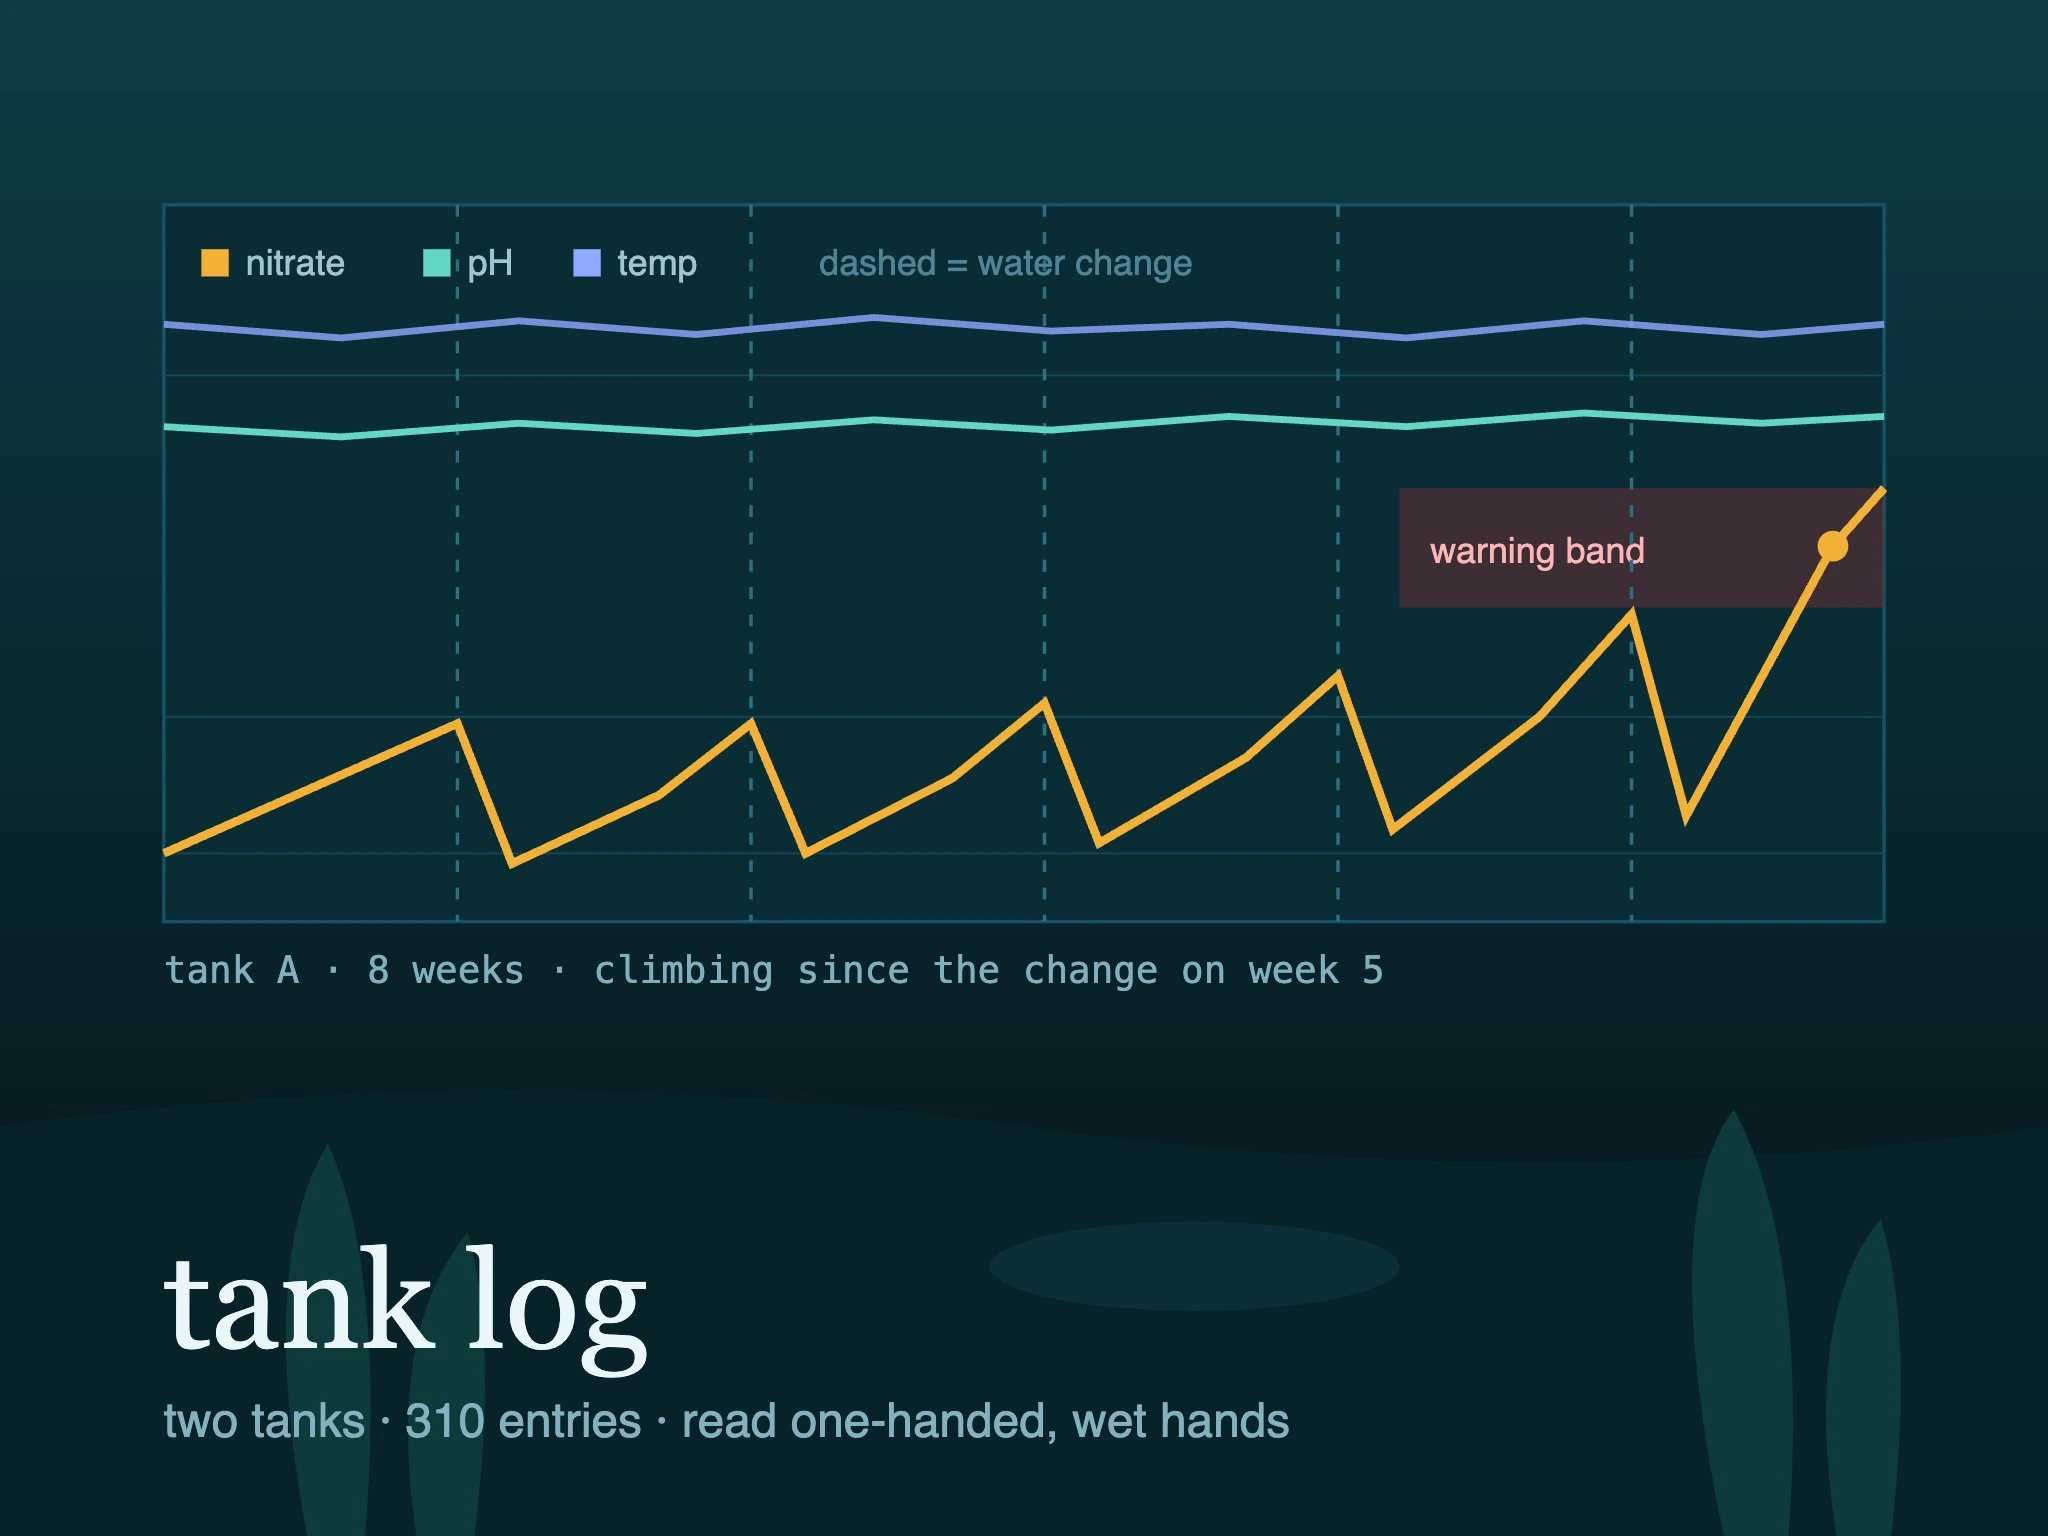
It is for me and, briefly, for two people from a local fishkeeping group who tried it. The problem is that the interesting signal in a tank is the direction of a number rather than its value, and a paper log makes you read a column of numbers instead of a line. It stores a test — date, tank, and whichever parameters I measured, since I do not measure all of them every time — plus water changes, feedings that were unusual, and anything I added. Then it draws each parameter over time on one page per tank, with the water changes marked as vertical lines so you can see what a change did.
- What I owned
All of it, and it is about two hundred lines of Python plus a template. The only design decision worth the name is that a test entry has optional fields rather than a fixed set, because in real fishkeeping you test what you are worried about. The plotting is done server-side into a static image on write, so the page is just HTML and loads instantly on the phone I use in front of the tank with wet hands. I wrote a rough alert that compares the last three readings of a parameter against the previous fortnight and shows a warning band, which has been right twice and cried wolf about five times.
- Technical & product decisions
I chose to generate the chart image on the server rather than render it in the browser, purely because the page is used one-handed on a phone standing next to a tank, and a static image with no JavaScript is instant. Nothing else about the project needed a decision. I also decided not to add any hardware — plenty of people put probes in their tanks and log continuously, and I looked into it, but the actual failure in my process was not recording the manual tests I already do, and a probe would not have fixed that.
- Hardest challenge
Making the warning useful rather than annoying, which I have not fully solved. A naive threshold on nitrate fires constantly because it climbs between water changes by design; what matters is the rate of climb compared to that tank's own normal. So the warning compares against a rolling baseline per tank rather than an absolute value, which cut the false alarms a lot but not to zero. I would rather it warned me too often than not at all, so I have left it slightly noisy on purpose.
- Result & impact
Two years of records, around three hundred and ten entries. It caught a nitrate trend in the older tank that turned out to be a dying plant behind the driftwood, about a fortnight before I would have noticed anything visually, which is the entire justification for the project. The two people from the fishkeeping group used it for a couple of months and stopped, which is fair. My six-year-old checks the chart because he likes the lines.
- Who else worked on it
Nobody worked on it with me, but two people from a local fishkeeping group used it for a couple of months and are the reason the optional-fields idea exists — both of them test different parameters from me and the fixed form was useless to them. One of them also talked me out of an averaging feature that would have hidden exactly the short spikes I built the thing to see. My six-year-old presses the button that redraws the chart, which he considers a job.